Monitoring Your Service Performance
NoTime offers no-cost reporting and real-time monitoring features. You can schedule the reports, scorecards for daily, weekly, monthly performance and monitor the daily stats from real-time reports.


Real-time Monitoring
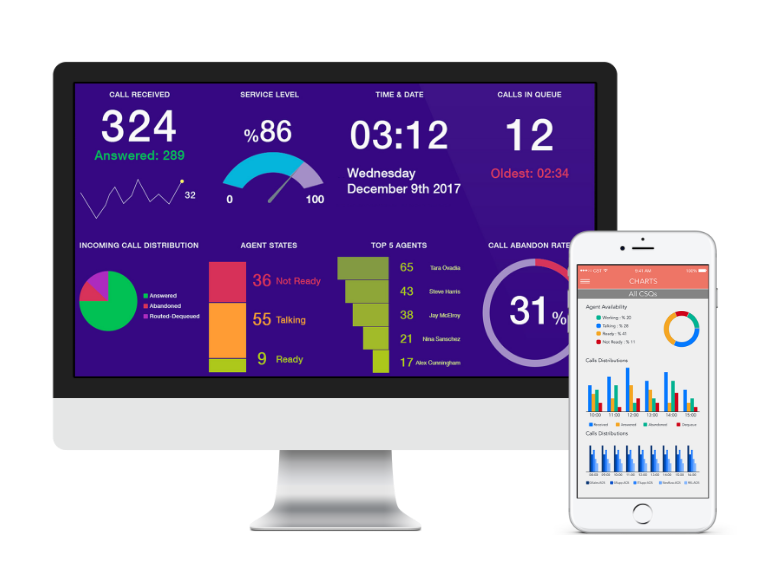
NoTime offers Comstice Wallboard solution as part of your service. You can create your dashboards using the existing key formance indicators and access it from a web browser, mobile app and desktop ticker.
Web-based Dashboards
You can create dashboards using Comstice Wallboard widgets, project it on a large screen and share with the others. Link to Comstice Widget Guide for Amazon Connect. Learn More
Comstice Wallboard Mobile App
Comstice Wallboard Mobile app helps you to monitor the real-time and daily stats from your smartphone.
Comstice Desktop Ticker
Comstice Desktop Ticker shows the calls in queue and oldest in queue on your desktop. So you can monitor inbound activity using this desktop application.


Reporting & Analytics
NoTime offers Comstice Quartz reporting and analytics platform as part of the service. You can access stock reports, create custom reports, schedule the reports and receive them as an email.


Stock reports
NoTime has stock reports available for your use. You can access those reports, create custom reports and schedule the reports. Click here to learn more about reporting and analytics features available.

Historical Dashboards
These are visual reports to help you to see the call center performance, forecast the call volumes and agent availability. Here are the top ten indicators you can use in your historical dashboards.

Scorecards
Scorecards are visual reports that you can create for the skills and the agents. Scorecards can be scheduled and delivered to stakeholders periodically. Download sample reports
